
While it’s always good to know what your upper limit for ad spend is for your industry, it has become more important thanks to Apple’s iOS 14 update. iOS 14 is not just impacting your Facebook Ads but Google Ads as well.
Understanding the Google Ad benchmark for your industry will help you set upper ad spend limits and also look out for certain misbehaving metrics that you can keep an eye out for. You will also be able to gauge your performance relative to your competitors as you prepare direct response conversion models for your marketing campaigns.
Google Ads performance benchmarks for different industries
Below, you’ll find the latest Google Ads benchmarks for different industries based on advertising on the search and display network. The averages for these Google ad metrics are for 21 industries, namely: Automotive, Arts & Entertainment, Business & Consulting, Beauty & Personal Care, Computers & Consumer Electronics, Clothing & Apparel, Dining & Nightlife, Education, Food & Groceries, Finance, Health & Medical, Home & Garden, Hobbies & Leisure, Internet & Telecom, Legal, Nonprofits & Charities, Occasions & Gifts, Retailers, Real Estate, Sports & Fitness, and Tourism & Travel.
Average click-through rate (CTR) by industry
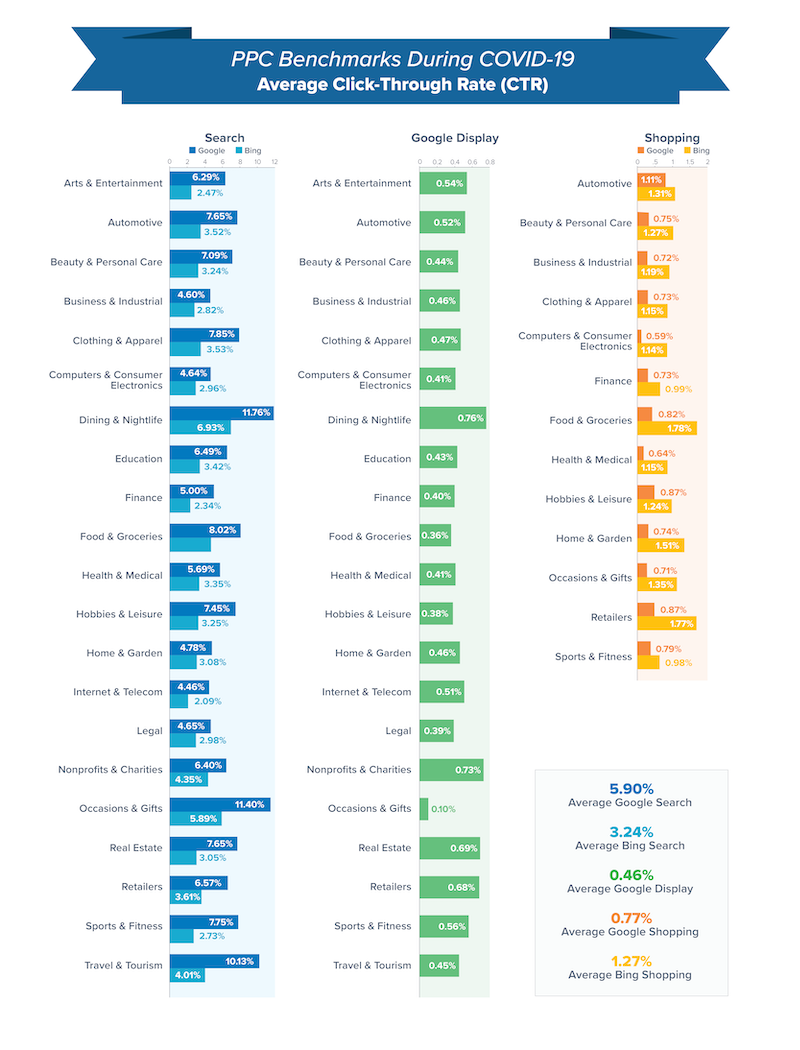
Figure 1: Average CTR by industry. Source – WordStream
The average CTR for Google Ads on the search network was 5.90 percent. This is a rise from the average in 2019 that stood at 5.09 percent (according to Instapage), with many businesses receiving more clicks on their ads since the COVID-19 outbreak. The industries with the highest CTRs were Dining & Nightlife (11.76 percent), Occasions & Gifts (11.40 percent), and Travel & Tourism (10.13 percent). Even the industries that traditionally experience low CTRs, like Legal and Finance, are doing well on SERPs, with click-through rates of 4.65 percent and 5.00 percent, respectively.
Meanwhile, on the Display Network, the average CTR for Google Ads across all industries is 0.46 percent. Dining & Nightlife has a high of 0.76 percent, while Occasions & Gifts with the lowest CTR at 0.10 percent.
These PPC metrics reveal the vast difference between the search and display network. The highest average on the Display Network didn’t even match the lowest average on search, proving that people are happy to interact with the ads that show up when they query specific terms on Google.
The data also tells us that audience targeting is the main issue you need to focus on to improve your CTR. A low CTR means that your targeting is off, and you need to utilize segmented marketing campaigns to connect with the right users.
Average cost per click (CPC) by industry

Figure 2: Average CPC by industry. Source – WordStream
The average CPC for Google Ads on SERPs is $2.76. On the other hand, advertisers on the display network paid an average CPC of $0.41 for their ads across all industries.
While the average CPC on search was moderately priced at $2.76, many industries are paying less for their clicks such as Food & Groceries ($0.87), Dating & Nightlife ($1.00), Beauty & Personal Care ($1.11), Clothing & Apparel ($1.17), Travel & Tourism ($1.43), Sports & Fitness ($1.45), Hobbies & Leisure ($1.64), Occasions & Gifts ($1.65), Nonprofits & Charities ($1.79), Arts & Entertainment ($2.11), and Automotive ($2.43).
Most of these industries are witnessing lower CPCs because there’s less competition for ad space due to the COVID pandemic. Notably, restaurants are paying below average CPCs on search as they limit their services to delivery and takeout.
Meanwhile, many professional industries (Real Estate ($3.03), Health & Medical ($4.81), Legal ($10.96)) face increased competition for ad space as their marketing becomes increasingly reliant on digital channels to connect with customers. As a result, they are paying more for the clicks they get on their ads.
On the display network, advertisers in the Occasions & Gift industry pay the highest CPC at $1.01. It’s followed closely by Finance and Hobbies & Gift at $0.60 and $0.52, respectively. However, the CPC for most industries is relatively inexpensive, with advertisers in Food & Groceries and Non-profits & Charities paying less than $0.20 per click.
With this data in mind, you should know that your ROI from your advertising efforts is determined by how much you’re paying for ad clicks. Therefore, you need to target valuable and inexpensive clicks, and you get to do this by increasing your quality score and refining your keywords to bring the right customers.
Check out our blog, Your Guide to Paid Search Advertising, to learn how to create effective search ads.
Average conversion rate by industry

Figure 3: Average conversion rate by industry. Source – WordStream
The COVID pandemic has had an adverse effect on business, with many industries unable to convert new customers in the way they did a few months back. The average conversion rate for Google Ads by industry stands at 5.63 percent, lower than the CVR in the previous years. Since March this year, advertisers have been struggling with their paid ads, with most experiencing significantly lower conversion rates for their ad campaigns.
Dining & Nightlife had the highest conversion rate at 15.64 percent. It was followed by Legal with a CVR of 10.08 percent. The majority of the industries had a CVR of between 5 – 7 percent.
On the other hand, the display network has significantly lower conversion rates, with the highest CVR witnessed in the Automotive industry (4.81 percent). The average CVR for the display network is 0.93 percent.
Despite the low conversion rates, many businesses have been able to pivot and come up with better conversion rate optimization techniques. Restaurateurs, for instance, are turning to take out meals to make up for the low numbers they receive in their dining halls. Similarly, automotive dealers have adjusted to show their inventory online because very few people are willing to visit a dealership in person.
Average cost per action (CPA) by industry
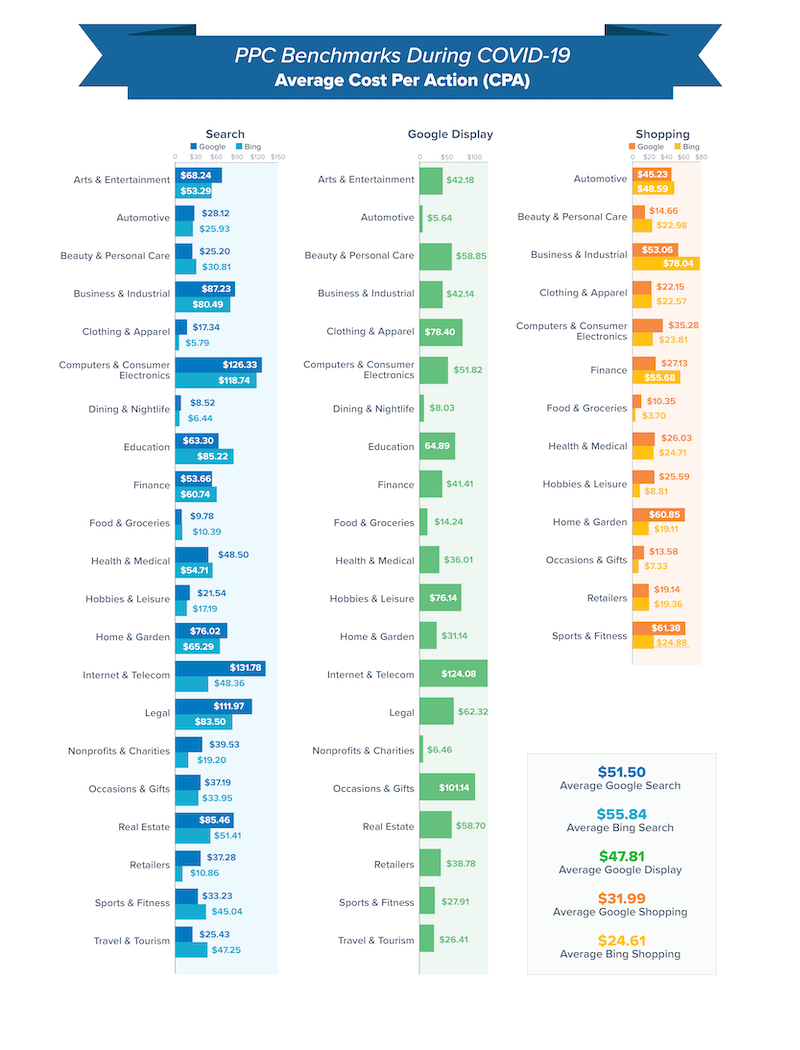
Figure 4: Average cost per action by industry. Source – WordStream
The average CPA for Google Ads across all industries is $51.50 for search and $47.81 for the display network. When you look at the averages for the display network, over $117 separates the highest and lowest industry averages, with Internet & Telecom at a high of $124.08 and Non-profits & Charities at a low of $6.46.
On the search network, Internet & Telecom still had the highest average CPA at $131.78, while Dating & Nightlife had the lowest at $8.52.
Several industries have an average CPA of over $100:
- On search – Internet & Telecom, Computers & Consumer Electronics, Legal
- On display – Internet & Telecom, Occasions & Gifts
Although the average CPA on search is lower than several years ago, advertising costs are expected to rise over time as more businesses turn to online channels to promote their products/services. To keep your CPA low on the Google Ad network, you should target high-intent searchers by ensuring you pick the right keywords for your campaign. Work with a growth marketing agency to identify high-impact keywords for your search ads.
Average daily PPC advertising budget by industry

Figure 5: Average PPC daily budgets by industry. Source – WordStream
Overall, businesses in all industries have reduced their ad budgets because of the uncertainty caused by the covid pandemic. But even in these uncertain times, advertisers are still finding success with smaller daily advertising budgets. Businesses that advertise across multiple platforms have optimized their campaigns to attract customers at lower costs.
The average daily spend on search across all industries is $24.02, while advertisers on the display network set aside $5.26 per day for advertising. The industries with the highest daily spend are Computers & Consumer Electronics ($68.78), Education ($66.84), and Internet & Telecom ($65.05). Advertisers in these industries have increased their campaign spending to capture the growing need for online services. On the other hand, advertisers in Travel and Tourism have reduced their budgets in response to the covid restrictions.
Use the Google Ads performance planner to create plans for your advertising spend and see how the changes affect your key campaign metrics and overall performance.
Knowing the Google Ads benchmark for your industry is essential as it lets you know how you’re faring in your advertising efforts. If your PPC metrics don’t compare favorably to the industry average, it means that there’s room for improvement as you work to draw more customers to your brand.
Be sure to use the relevant keywords and creative offers to optimize your pre-click experience to draw as many high-value prospects as possible. Also, optimize your post-click experience with personalized pages to boost conversion rates.
Let us know in the comments sections what your PPC metrics look like and if they match the industry averages we have shared above.
Want to know more? Get actionable tips for converting customers via search from the team at Growth Marketing Genie.
Be sure to also follow us on Facebook, LinkedIn and Instagram for more key insights into how to make your business grow today.
Book in a Free Consultation